

According to TradingView data examined by CryptoSlate, the Bitcoin (BTC) volatility index reached an all-time low on December 27.
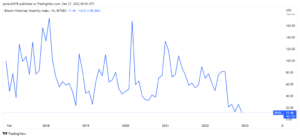
The above chart depicts the BTC volatility index since February 2017. The metric fell to 20.00 near the end of 2022 and continued to fall until it reached its lowest point in BTC history at 11.46.
Prior to 2022, the all-time low for this metric was just above 20.00 in late 2018 and early 2019.
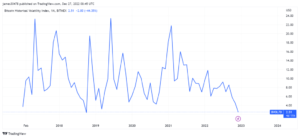
The above chart shows the same volatility index with a 7-day moving average. This chart shows that whenever the BTC volatility index hits bottom, it immediately follows with an aggressive spike.
The above chart depicts the BTC volatility index since February 2017. The metric fell to 20.00 near the end of 2022 and continued to fall until it reached its lowest point in BTC history at 11.46.
Prior to 2022, the all-time low for this metric was just above 20.00 in late 2018 and early 2019.
The above chart shows the same volatility index with a 7-day moving average. This chart shows that whenever the BTC volatility index hits bottom, it immediately follows with an aggressive spike.
To read our blog on “The severe Bitcoin crisis has arrived,” click here