

A common stock indicator in technical analysis is the moving average (MA). The indicator creates a continuously updated average price over a given time period to smooth out price data, as its name implies.
By examining prior price actions, moving averages in technical analysis assist in determining trend directions.
Moving averages are frequently used when examining the Bitcoin price. The most stock-like of all cryptocurrencies, Bitcoin has historically reacted favorably to such analysis.
Analysis of Bitcoin’s moving averages (MAs) can be used in conjunction with other metrics to assess the state of the market, despite the fact that technical analysis (TA) is still a contentious subject in the cryptocurrency industry.
Moving averages can be used to pinpoint where support and resistance are formed in the context of Bitcoin.
Using historical data, we can use moving averages to pinpoint instances when the price of bitcoin fell to its cycle lows.
The 60-day, 120-day, 200-day, 360-day, and 720-day moving averages are particularly significant when examining Bitcoin.
Each time the price of Bitcoin fell beneath these MAs, the market experienced what some analysts refer to as a “generational buy” opportunity.
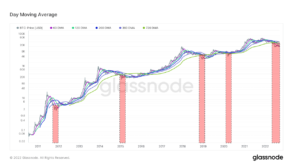

For the fifth time ever, according to data from Glass node, Bitcoin has dropped below all significant moving averages.
The current period of time that BTC has been trading below the moving averages is also the longest of all time, lasting nearly twice as long as the drops we’ve seen at the end of 2011, 2015, 2019, and 2020.
Other important indicators for identifying the market cycle include moving averages as well. The Investor Tool, developed by analyst Philip Swift, is one of those indicators.
The indicator, which is a tool for long-term investors, is made up of two simple moving averages of the price of bitcoin: the 2-year MA and a multiple of 5x the 2-year MA.
To read our blog on “Buying of Bitcoin by a major corporation is confirmed,” click here